Friday, September 21, 2012

Valgrind

Starting with MonoTouch 5.4 it is possible to use Valgrind on a MonoTouch project. In some cases Valgrind is invaluable in finding strange crashes, in particular when freed memory is accessed.

This is what you need to do:

Download latest Valgrind (3.7.0 as of this writing). Extract somewhere, and compile:

./configure --enable-only32bit --prefix=/usr/local
make
sudo make install

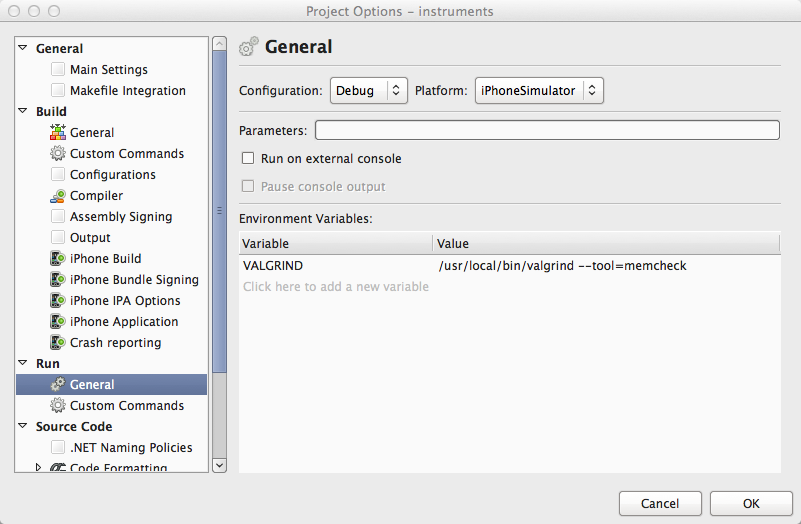
Now open the project you want to valgrind, and set the VALGRIND environment variable to the command to execute to use valgrind:


Run (not debug) your project. You will see this in the Application Output:


In particular read the second line, you need to do exactly as it says: use gdb to attach to the app and then detach again. Once you've done this the app should start up (slowly, Valgrind makes your app a lot slower). Quite much output is printed to the Application Output, most of it is just noise though.

The messages you should be looking for (if you're trying to figure out why your app is crashing), are:

  • Invalid read of size X
  • Invalid write of size X

You can try to track down the reason for the following messages if you're just trying to find out why the app behaves strangely. Just have in mind that most of these messages are harmless, it can be due to "smart" optimizations in the code or by the compiler which valgrind doesn't understand.

  • Conditional jump or move depends on uninitialised value(s)
  • Use of uninitialised value of size X

For a thorough explanation of all these messages from Valgrind you should read their documentation.

Thursday, August 2, 2012

I can't debug on device!


My app won't connect to MonoDevelop when debugging on device, what do I do?


Here are a few tips to track down this particular failure:


  • Switch between USB and WiFi mode. Just go to MonoDevelop's Preferences and toggle this check box:


  • Enable diagnostic output when the app tries to connect to MonoDevelop. This is done by adding "-v -v -v" to the additional mtouch arguments in your project's options:


    Now rebuild your app, and you should get more information on what's happening in the iOS Device Log:

    MonoTouch: Added IP to look for MonoDevelop: 123.123.123.123
    MonoTouch: MonoDevelop Port: 10000 Transport: USB
    MonoTouch: Successfully received USB connection from MonoDevelop on port 10000, fd: 5
    MonoTouch: Processing: 'connect output'
    MonoTouch: Successfully received USB connection from MonoDevelop on port 10000, fd: 6
    MonoTouch: Processing: 'start debugger: sdb'
    MonoTouch: Debugger loaded with custom transport (fd: 6)
    MonoTouch: Successfully received USB connection from MonoDevelop on port 10000, fd: 7
    MonoTouch: Processing: 'start profiler: no'
    

    Some of this information should also (but probably won't since that's the problem you're trying to solve in the first place) show up in MonoDevelop's Application Output pad (everything after the 'connect output' line, since that's when the app's standard output is redirected to MonoDevelop):

    Please ensure your device is connected...
    Connected to: Rolf Bjarne Kvinge’s iPad
    Killed the process 'instruments' with pid 1287.
    Launching /private/var/mobile/Applications/06007ED7-84C1-4D67-A893-7C04CE477F15/instruments.app -debugtrack -monodevelop-port 10000 -connection-mode usb
    
    MonoTouch: Successfully received USB connection from MonoDevelop on port 10000, fd: 6
    MonoTouch: Processing: 'start debugger: sdb'
    MonoTouch: Debugger loaded with custom transport (fd: 6)
    MonoTouch: Successfully received USB connection from MonoDevelop on port 10000, fd: 7
    MonoTouch: Processing: 'start profiler: no'
    
    Loaded assembly: /private/var/mobile/Applications/06007ED7-84C1-4D67-A893-7C04CE477F15/instruments.app/Mono.Security.dll
    Loaded assembly: /private/var/mobile/Applications/06007ED7-84C1-4D67-A893-7C04CE477F15/instruments.app/System.dll
    Loaded assembly: /private/var/mobile/Applications/06007ED7-84C1-4D67-A893-7C04CE477F15/instruments.app/System.Core.dll
    Loaded assembly: /private/var/mobile/Applications/06007ED7-84C1-4D67-A893-7C04CE477F15/instruments.app/monotouch.dll
    Loaded assembly: /private/var/mobile/Applications/06007ED7-84C1-4D67-A893-7C04CE477F15/instruments.app/MonoTouch.Dialog-1.dll
    Loaded assembly: /private/var/mobile/Applications/06007ED7-84C1-4D67-A893-7C04CE477F15/instruments.app/instruments.exe
    Thread started: Finalizer


    This time everything connected fine, but if error messages may be printed to the iOS Device Log if anything goes wrong.

  • Restart your device and machine.
  • Last solution: file a bug or ask on the MonoTouch mailing list. Please remember to include the information you got from the previous steps, that's the first thing anybody will ask you anyway.

Thursday, May 31, 2012

MonoTouch debugging tips

This is mostly for myself so these ideas aren't lost in bugzilla comments or GMail's bottomless mail pit.

How to create a crash report when the app is hung


Update

There is a much easier way to do this. All iOS versions and devices include a way to force quit an application:


  • Hold down the On/Off button until "slide to power off" appears.
  • Release the On/Off button.
  • Hold down the Home button.
  • After a few seconds the app will be terminated, and a crash report will be generated (the app's exception code will be 0xdeadfa11).


This snippet will cause the app to generate a crash report after 30 seconds (feel free to modify the timeout to ensure it only crashes after you've managed to hang the app).


Once the app has crashed, you should get a crash report in Xcode, hopefully with stack traces giving some clues as to what the app was trying to do when it hung. If you can't make heads and tails of the crash report, you should file a bug (remember to attach the crash report!).


Just replace the Application class in Main.cs with this (if you've made modifications to the Main.cs file yourself, you'll have to modify this code accordingly).


public class Application {
    [System.Runtime.InteropServices.DllImport ("libc")]
    static extern int strlen (IntPtr zero);
    static unsafe void Tick ()
    {
        int zero = 0;
        int* z = &zero;
        // This is so that strlen is initialized
        // (so no/fewer locks are required later)
        strlen ((IntPtr) z); 
        // The sleep interval can be modified to sleep
        // until you're sure the app has hung.
        System.Threading.Thread.Sleep (30000);
        // Create a crash report
        strlen (IntPtr.Zero);
    }

    static void Main (string[] args)
    {
        new System.Threading.Thread (Tick).Start ();
        UIApplication.Main (args, null, "AppDelegate");
    }
}


Next tip will go here next time I remember something I don't want to forget again

Saturday, April 14, 2012

Native crashes in MonoTouch

If you use MonoTouch a bit, you will once in a while run into native crashes. In a perfect world you'd never see such a horrible thing, but unfortunately the world isn't perfect, and in real life there are several ways you can end up crashing your app. Usual debugging techniques with MonoDevelop will not work, but with some ingenuity you can figure out what's going on. And you will catch a glimpse of how the world is for those poor guys who can't develop in C#!

Now, how do you find out what happened? You need as much information as possible, and information related to a native crash is twofold:
  • Crash report.
  • Console output.

Where you can find each differs depends on whether you're running in the iOS simulator or on an iOS device.

You're running in the iOS simulator.


In this case, the console is the system console on your Mac. You can find the Console application in Applications -> Utilities -> Console. This is how it looks like:


Now let's see what happens if you crash in the simulator. You will get this dialog:


and if you click the Report button, you'll see the crash report:


The same crash report is also available in the Console, in case you dismissed the dialog:


You're running on an iOS device.


In this case, you want Xcode's Organizer. Open Xcode, and go to the Window -> Organizer menu entry.


Here you will find crash reports under the Device Logs node, and the obviously the console output will be under the Console node.

Now what?


Some times the information you found tells you exactly what happened.

This is the case for an unhandled exception, in which case you'll see something like this in the console:

13/04/12 4:28:54.101 PM CrashReporting: 
Unhandled Exception: System.Exception: Unhandled I am!
  at CrashReporting.AppDelegate.UnhandledException () [0x00000] in /Users/rolf/Projects/CrashReporting/AppDelegate.cs:27
  at MonoTouch.Dialog.StringElement.Selected (MonoTouch.Dialog.DialogViewController dvc, MonoTouch.UIKit.UITableView tableView, MonoTouch.Foundation.NSIndexPath indexPath) [0x0000b] in /mono/ios/MonoTouch.Dialog/MonoTouch.Dialog/Elements.cs:691
  at MonoTouch.Dialog.DialogViewController.Selected (MonoTouch.Foundation.NSIndexPath indexPath) [0x00029] in /mono/ios/MonoTouch.Dialog/MonoTouch.Dialog/DialogViewController.cs:518
  at MonoTouch.Dialog.DialogViewController+Source.RowSelected (MonoTouch.UIKit.UITableView tableView, MonoTouch.Foundation.NSIndexPath indexPath) [0x00019] in /mono/ios/MonoTouch.Dialog/MonoTouch.Dialog/DialogViewController.cs:364
  at (wrapper managed-to-native) MonoTouch.UIKit.UIApplication:UIApplicationMain (int,string[],intptr,intptr)
  at MonoTouch.UIKit.UIApplication.Main (System.String[] args, System.String principalClassName, System.String delegateClassName) [0x0004c] in /mono/ios/monotouch/src/UIKit/UIApplication.cs:38
  at CrashReporting.Application.Main (System.String[] args) [0x00000] in /Users/rolf/Projects/CrashReporting/Main.cs:17

in this case it's pretty obvious what happened. But this isn't often the case, usually the information is at best unfamiliar unless you already have experience debugging native crashes (and in some cases the crash happens way after the underlying cause, and any relevant information is long lost. When this happens you'll have to resort to more creative debugging techniques).

I will write more blog posts describing some of the most common reasons for native crashes later, but in the mean time you have a few options to get help:


In all cases be sure to include all information you're able to gather, have in mind that even though the console output and crash reports may be greek to you, it may provide valuable information to somebody else.